Visualization Tools for » PecubeGUI inversions (PyPIVot / MATPIVot)
Understand the interdependence of your parameters better.


PecubeGUI Visualization Tools
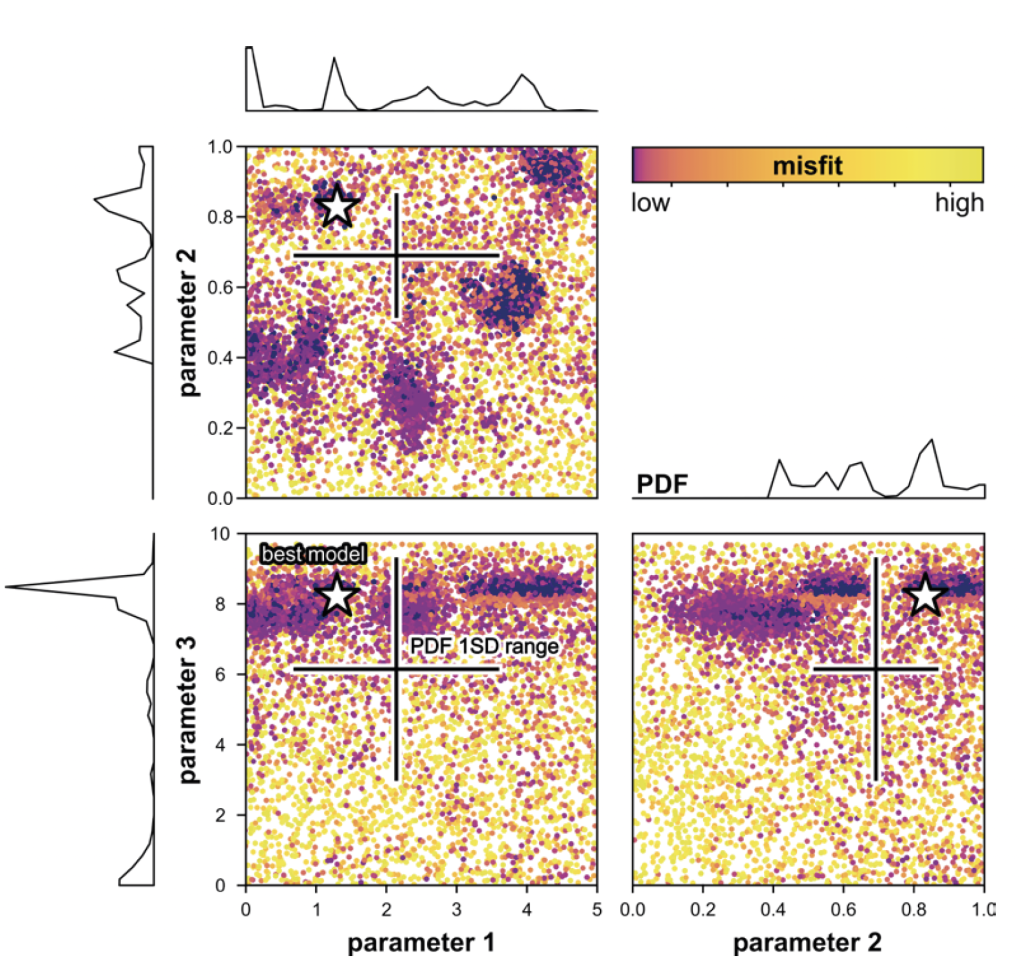
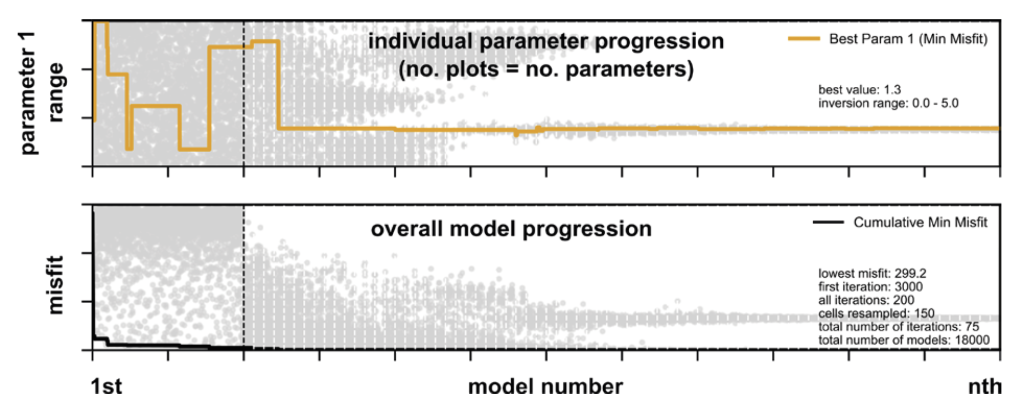
PyPIVoT and MATPIVoT (PecubeGUI Visualization Tools) are collections of newly developed Python- and Matlab-based visualization scripts designed to help users of PecubeGUI better their understanding of inversion parameter interdependence and the parameter space explored in inversion. PecubeGUI is a thermal-kinematic modelling software used in thermochronology.
Python: PyPIVoT – Code, examples and instruction on Zenodo for Python (https://zenodo.org/records/17079596)
Matlab: MATPIVoT – Code, examples and instruction on Zenodo for Matlab (https://zenodo.org/records/17110623
Visualization Tools for He trends (PyHeAT / MATHeAT)
Identify age, elevation, eU, ESR trends in your (U-Th-Sm)/He data.

Helium Age Trends Visualization Tool
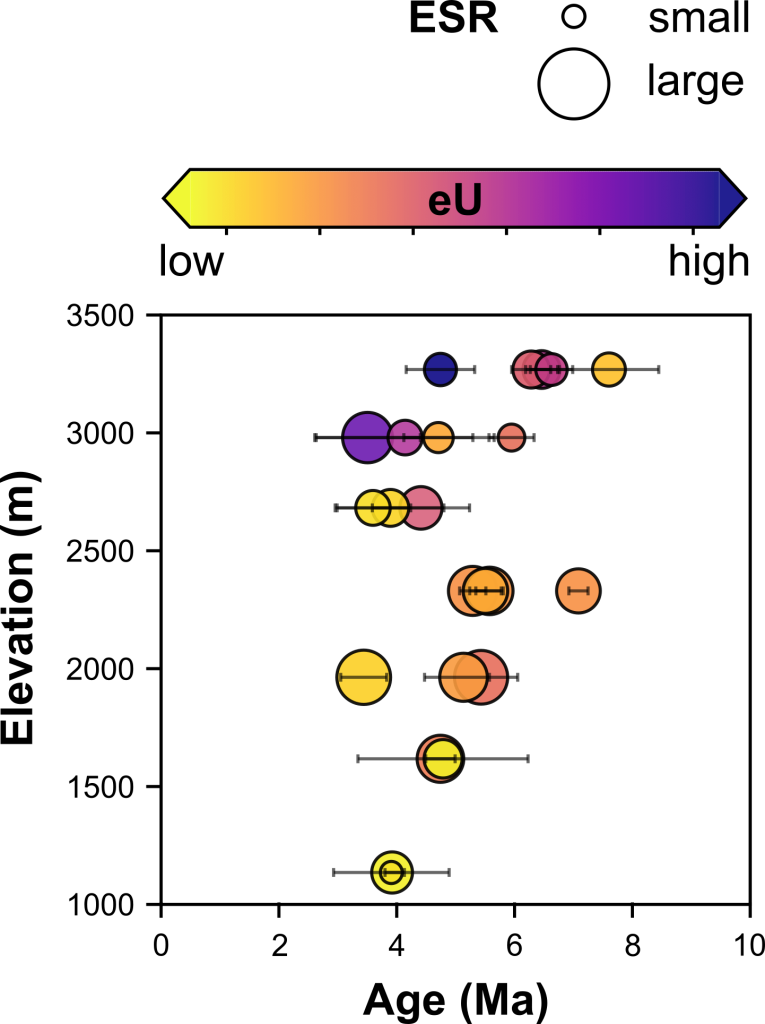
Python: PyHeAT (Helium Age Trends Visualization Tool) is a Python-based visualization script designed to help users identify and understand trends in their helium thermochronology (i.e. (U-Th)/He in Apatite or Zircon) ages compared to elevation, eU, and ESR.
PyHeAt – Code, examples and instruction on Zenodo for Python (https://zenodo.org/records/17096096)
Matlab: MATHeAT (He Age Trends Visualization Tools) plots helium thermochronology [i.e. (U-Th-Sm)/He in Apatite or Zircon] data to visualize, and thus detect trends in age (Ma), elevation (m), eU (ppm), and ESR (μm).
MATHeAT – Code, examples and instruction on Zenodo (https://zenodo.org/records/17115445)

Lingxiao Gong
University of PotsdamLingxiao studies landscape development in the Kyrgyz Tian Shan.
gong@uni-potsdam.de

Isabel Wapenhans
University of PotsdamIsabel studies landscape development in the Eastern Alps.
wapenhans@uni-potsdam.de
